…. Continuing the report from last week… see Part 1 dated 5 May.
 Did you wonder why a little motel blog has been having a rave about boring irrelevant issues such as Taupo’s falling fishing licence sales? We confess… This week NZ’s tourism boom is being discussed at NZ’s biggest tourist industry trade event (TRENZ) at Rotorua – attracting over 350 key tourism industry people and trade buyers from 28 countries. They are looking for new tourist opportunities to exploit, particularly in the quieter ‘shoulder season’ – like right now.
So this report is specially for them to discover… if they are lucky.
In addition to those shakers and movers in the tourist business, it is also concerning to all Tongariro anglers and Turangi residents that the tourism advantages of Taupo fishing have not been promoted for so long. Falling licence revenue means less will be available to maintain the fishery in many ways, from research into the lake food chain, to maintaining access tracks, etc..
Now the annual fishing licence sales pattern is less than half the number thirty years ago it should be a major concern to Taupo Council? Despite claiming to be a tourist economy, they probably have not even noticed. Comparatively, in Turangi this is a major concern. It affects everyone. It is no secret that Turangi is struggling economically.
 The resident population continues to decline (down 8.9% from 2006 to 2013, now under 3,000). The shopping centre has far too many empty shops. Two more shops (businesses originally established over 30 years ago) have closed recently. Property prices languish at 25% below the 2007 peak (that is for residential housing – not tourist motels, which are booming!).
With so many wonderful tourist amenities such as the Tongariro Crossing, Whakapapa skifields, dual National Parks, Tongariro River, Lake Taupo, mountain bike tracks, all year round wild trout fishing, rafting, hiking trails, strategic location on SH1 half way Auckland & Wellington, etc. this has to be just a temporary slump. Turangi’s economy can only go up from here.
The local problem, common with many other small NZ towns, is lack of employment opportunities.
The only industry surviving in Turangi is “tourism” which is largely based around the traditional trout fishing on the Tongariro River. International anglers paying homage to the Tongariro River are BIG business. They come here regularly, many visit TRM several times each year, stay longer, spend more, and keep on coming back. So many more should be targeted.
 We are grateful to DOC (Department of Conservation manage the Taupo fishery) and Fish & Game for providing the extensive summaries of licence sales to confirm the pattern. TRM are hesitant to push this issue as much as it deserves as SWMBO will no doubt be accused of vested interest in more anglers trying to pump sales to improve motel occupancy. So?
The issue is that this Taupo/Tongariro fishery is a valuable national treasure that is not sufficiently appreciated by local or central Government and should be nurtured and marketed far more. They should be promoting the competitive advantage of Taupo/Tongariro particularly at this ‘shoulder’ time of the year – when all other wild trout fisheries close for spawning, this region remains ‘open’ all year round. Instead, sadly, it has been neglected.
The winter spawning runs are legendary. Historically they are world famous.
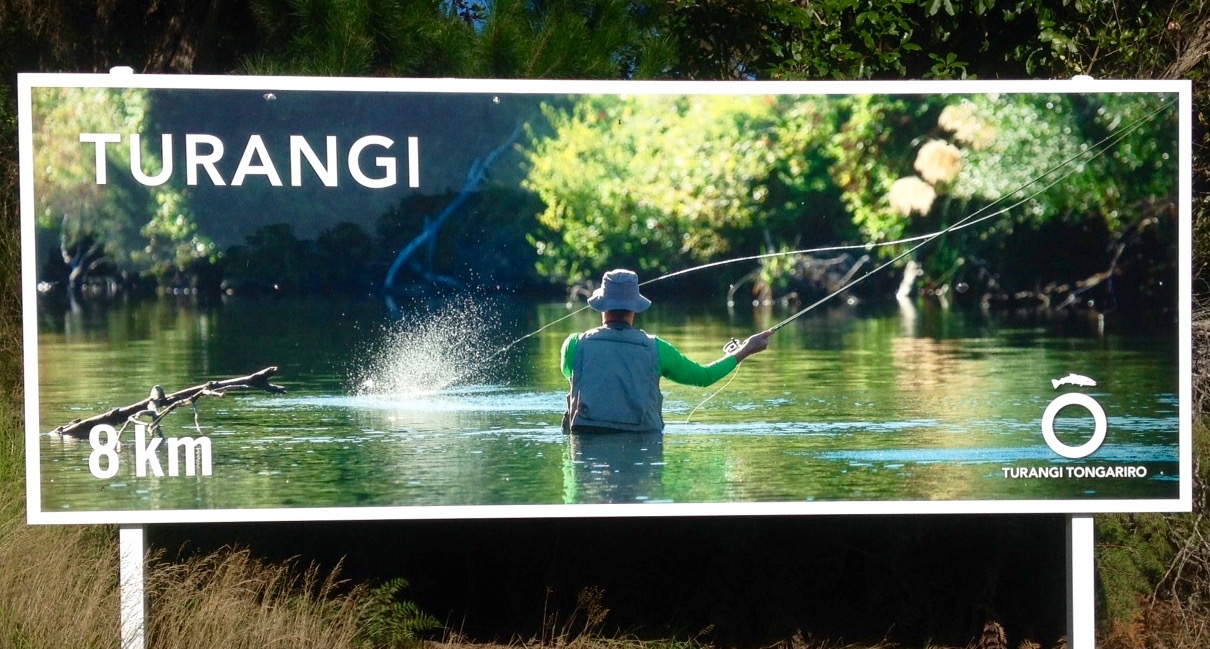
The Tongariro River is the best known trout river in NZ, even without any promotion. But in the bigger picture, in the immediate future, the fall in Taupo licence sales needs to be arrested by traditional destination advertising.
 Now that tourism is NZ’s largest ‘earner’ (Tourism now tops dairy as NZ’s biggest foreign exchange earner bringing in more than $11 Billion from overseas visitors in the last year and worth close to $30 Billion annually when domestic traffic is counted.) the Tongariro River’s drawing power commands far more respect.
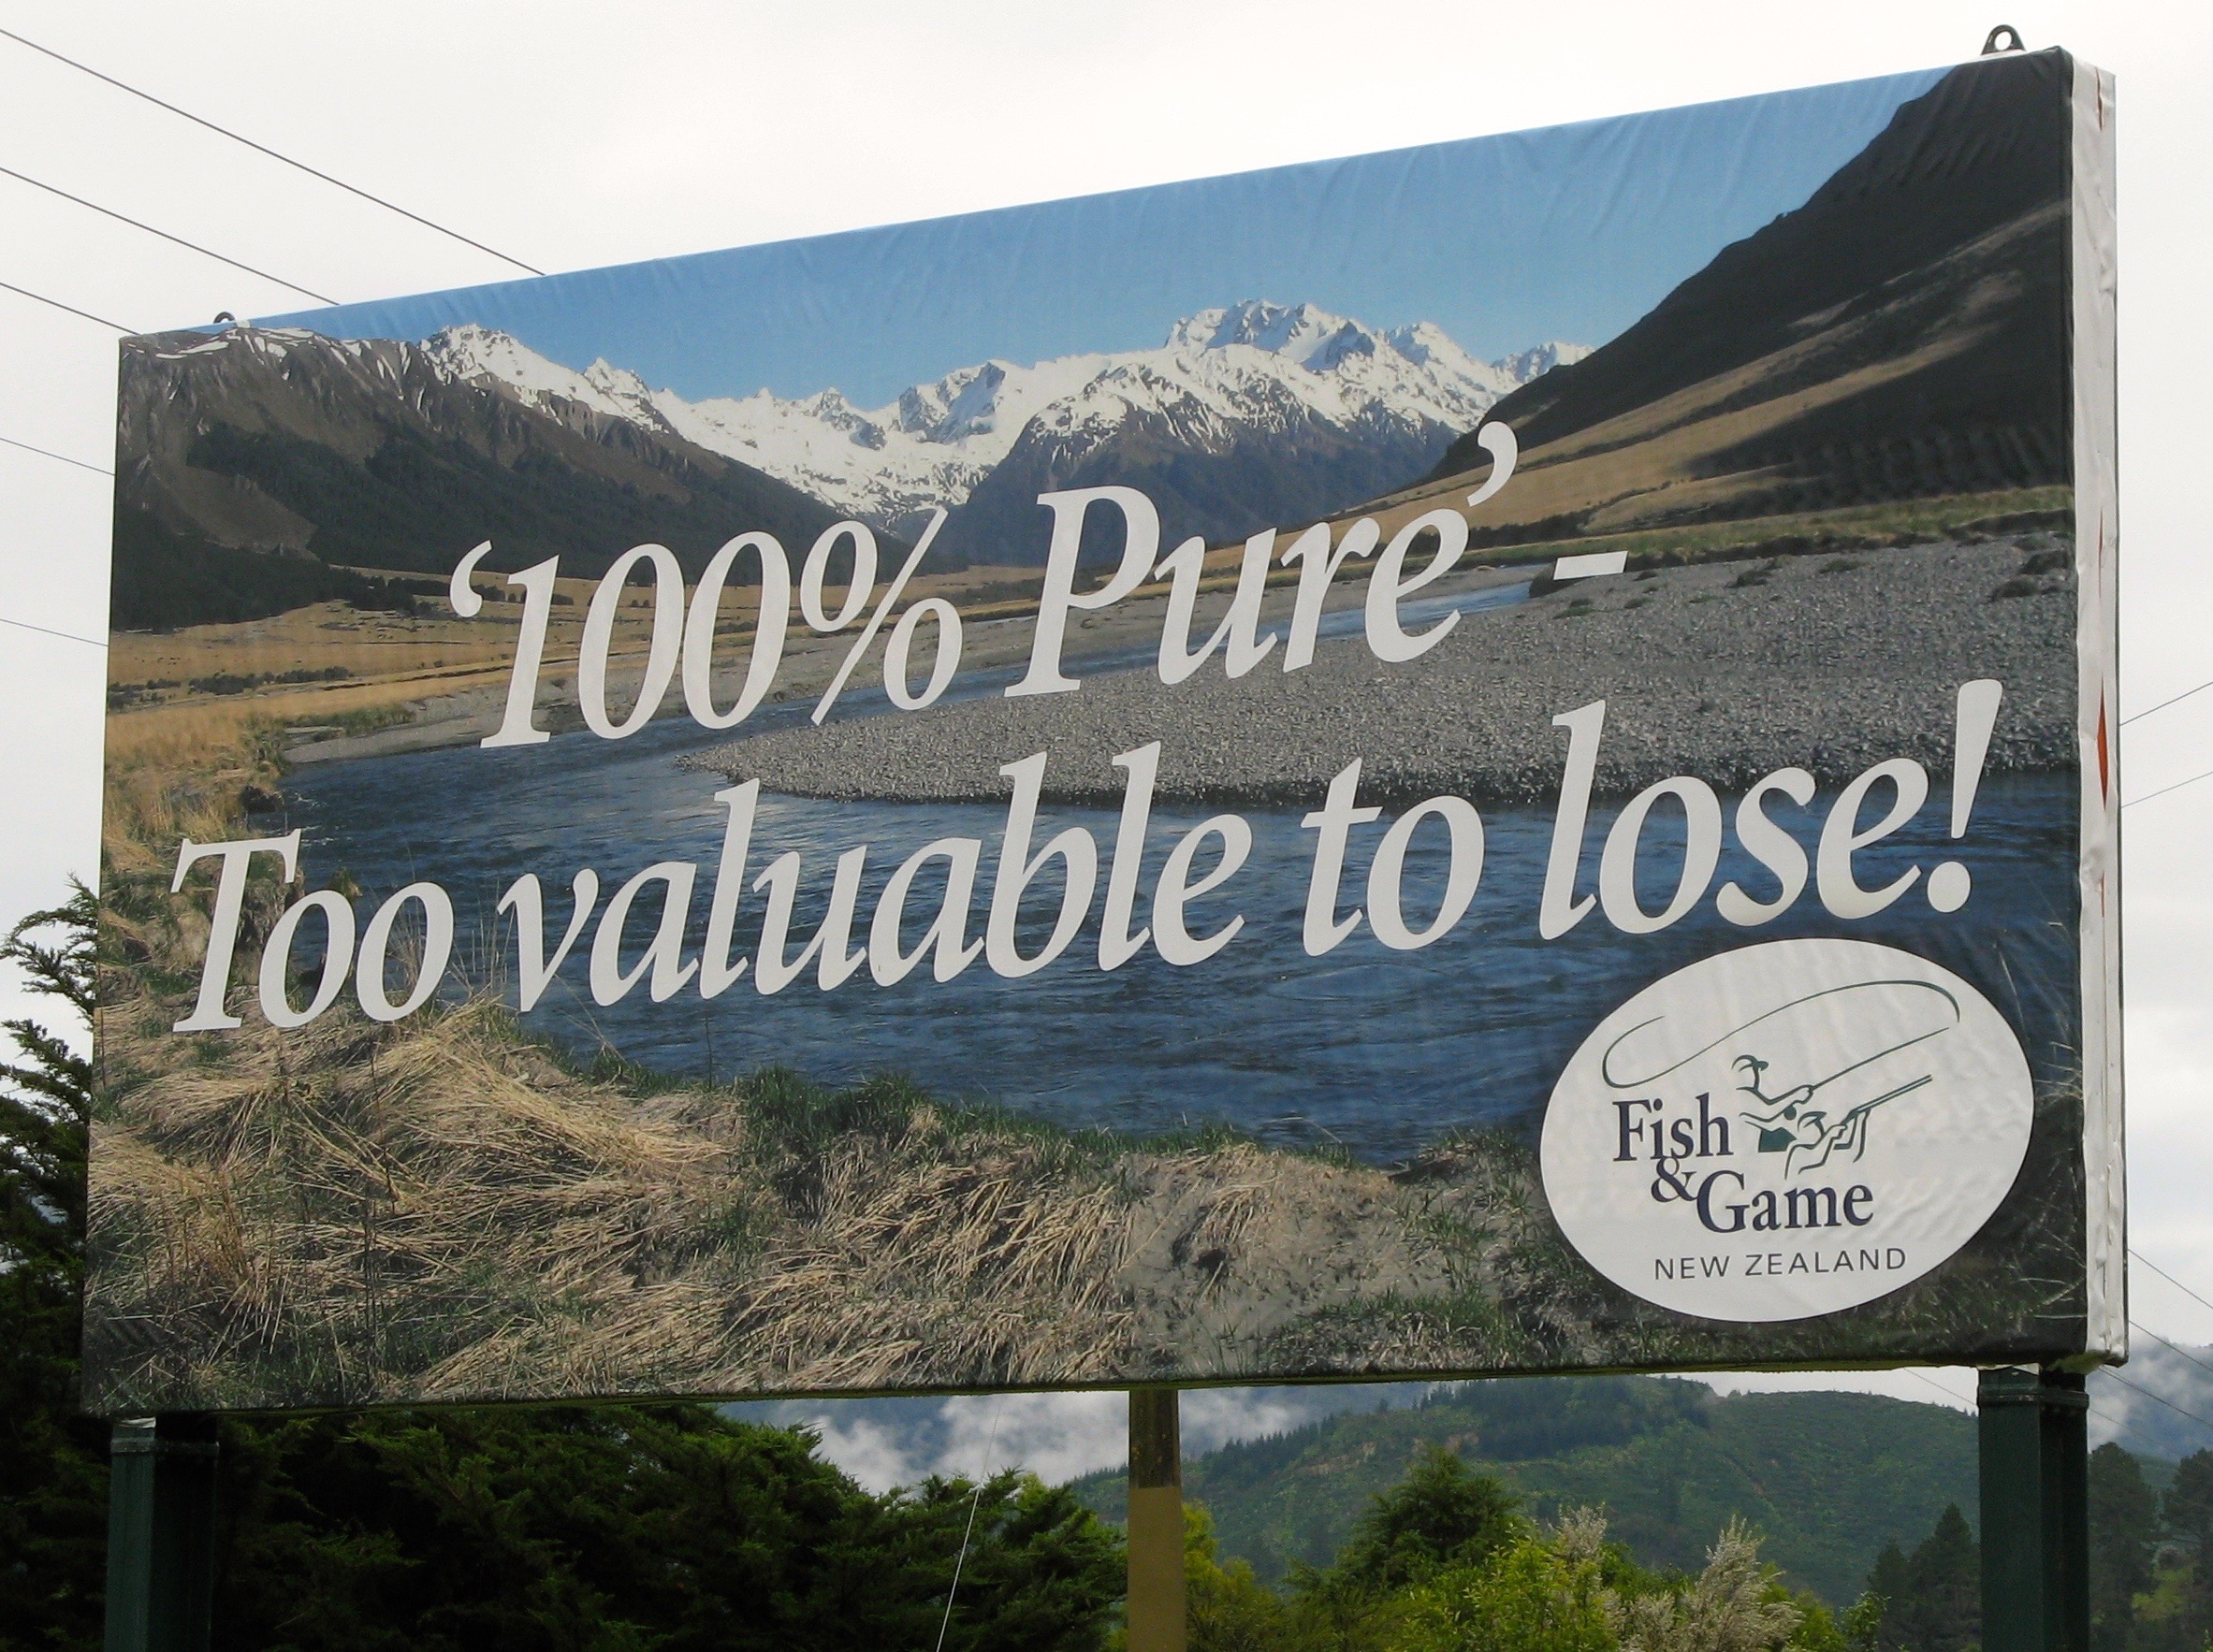
The Taupo trout fishery, largely a wonderful 100% pure natural phenomena offering a wild trophy trout fishery open all year, has a significant major strategic commercial advantage over the rest of the world.
Unfortunately the falling licence sales confirm how badly it has been neglected. It deserves much better.
DOC may claim their job is ‘management’ as they cannot promote the fishery without an adequate $$$ budget? Taupo Council may also claim it is not their responsibility. etc…..
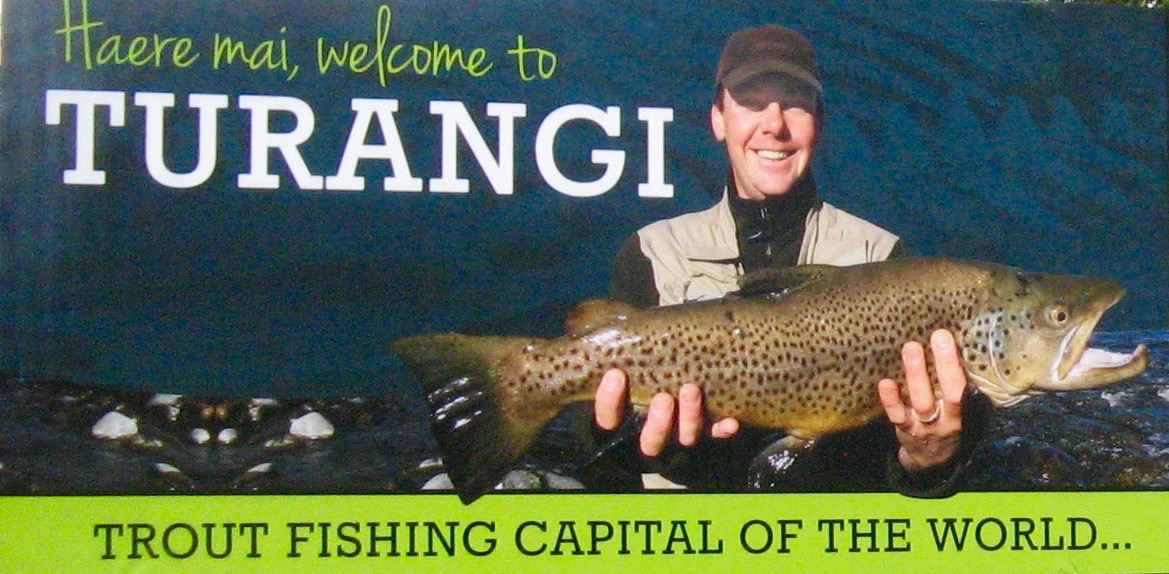
 So nothing happens. They shirk their responsibility. (This is the same council that fined TRM for promoting Turangi as the Trout Fishing Capital of the World…) They rely on many small local businesses to do their promotion for them ( i.e. see TRM report yesterday with eight other fishing reports promoting the Tongariro River). Somehow the Tongariro trout fishery has been forgotten by them for far too long.
As mentioned in the 5 May report, compared to the excellent promotion to attract tourists to the trout fishing in Otago and Southland, the local council and DOC have failed miserably.
This tragedy is reflected in the graphic illustration below by directly comparing Taupo’s falling licence sales since 2001 against F&G stronger consistent sales maintained throughout the rest of NZ.
Please do not blame DOC. We have finally identified the problem. The evidence is irrefutable.
The similar strong sales pattern was maintained for twenty plus years until SWMBO bought TRM and started promoting the Tongariro fishing….
I rest my case.
Compare:
Annual Taupo licence sales: National fishing licence sales 1981 to 2014

Year – Taupo : NZ – Totals & Adult Season licence sales:
 1981 74518 10816 76526 57664
1982 69515 10945 77395 60403
1983 77193 11784 75195 60050
1984 76303 12521 78113 62783
 1985 82291 13410 78143 61426
1986 83829 12635 80386 62525
1987 80010 13226 74765 59944
1988 79103 12548 73948 59505
 1989 78994 12548 69486 56082
1990 75767 11591 65217 52976
1991 69038 10511 63043 48183
1992 66788 10275 60193 46199
1993 68142 10307 60456 45695
1994 70705 11587 65064 49208
 1995 66844 11552 70910 53041
1996 68285 11848 71583 54555
1997 62590 11843 74204 57153
1998 67174 12571 73073 56796
1999 70637 13214 72104 55996
2000 74293 14008 71738 50194
2001 66697 11659 71603 39741
 2002 68067 13488 67935 35902
2003 56454 12290 67718 35082
2004 54036 12524 69596 36311
2005 54229 12557 69607 39932
2006 55160 12429 72092 38802
2007 54116 12065 74626 39461
 2008 48760 10955 75982 40291
2009 44960 10087 75404 38632
2010 41363 8650 76192 38532
2011 42235 9791 72701 37114
2012 41332 8643 74791 38789
2013 39640 8652 77386 39489
2014 39513 8965 78468 39379