Turangi is a bargain but prices on the rise
(Images from TRM library)
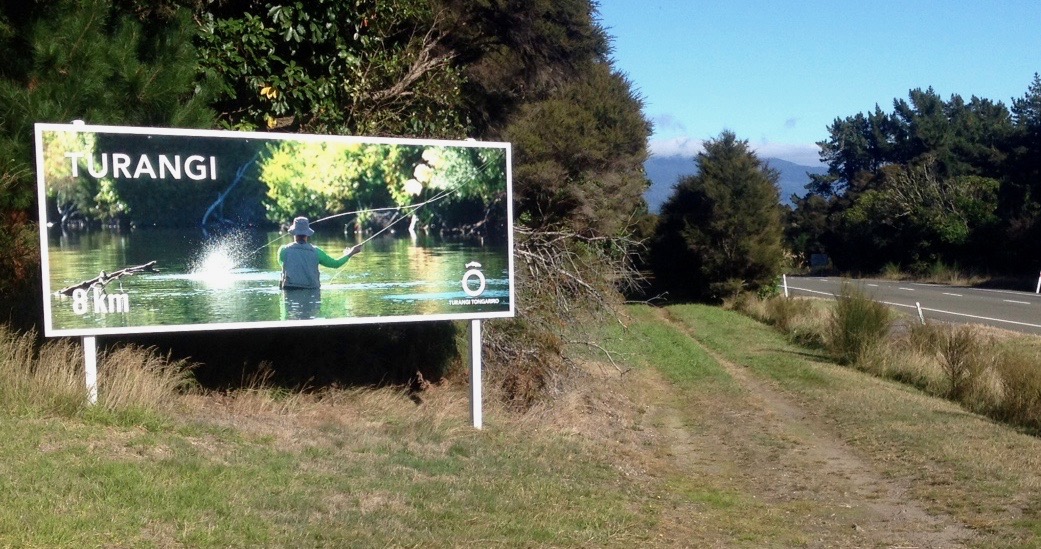
 Turangi’s real estate market is heating up but it is still one of the least expensive areas in the country to buy a house.
Data from market analysis company CoreLogic shows the median value of Turangi properties rose by 3.9 per cent in the three months to April 30.
The 3.9 per cent rise, to $226,050, is the greatest median value increase in both the Taupō and South Waikato Districts.
Turangi is one of the cheapest towns in the country, but sale prices rose by a greater percentage than anywhere else in the Waikato recently, according to CoreLogic data.

Houses in other Taupō suburbs, such as Hilltop, Waipahihi and Nukuhau, rose just 2.6, 0.9 and 0.7 per cent in value, according to CoreLogic’s “E-Valuer estimate”.
The E-Valuer estimate is a valuation based on recent, nearby comparable sales.
Nationwide, Tūrangi is the sixth least expensive regional town in New Zealand.
Turangi’s popularity as a holiday home destination is seeing a resurgence, real estate company owner Wai Johnoson says.

Taumaranui is the cheapest [estimated median value of $ $146,800], followed by Kaikohe in Far North District ($180,000), Fordlands in Rotorua ($184,000), Tokoroa ($189,900) and Te Kūiti ($203,200).
Kawerau ($224,000) comes in with the eighth-lowest median value, followed by Kaitaia ($225,800), Ōhakune ($249,300) and Ōpōtiki ($258,850).
Wai Johnson, Century 21 Premier Turangi owner, said CoreLogic’s median value for homes in Turangi ($226,050) was affected by the range of properties selling.
“We’ve still got houses for sale beneath that, but I suppose the big difference in the past 18 months is that more and more properties are now selling above that,” she said.
“With Taupō house prices rising in recent years, many looking for a holiday house near Lake Taupō are now considering Turangi and the lifestyle it offers.”
The median value of a house in Turangi rose by 14.6 per cent from $194,600 to $223,100 in the 12 months March 2017 to March 2018, according to CoreLogic.
Turangi is one of the cheapest towns in the country, but sale prices rose by a greater percentage than anywhere else in the Waikato recently, according to CoreLogic data
The regional towns with the highest median values were Mt Maunganui ($879,000), Pāuanui ($853,050), Mangawhai Heads ($828,800), Matua in Tauranga (820,950), Omokoroa north of Tauranga ($814,950), Waihī Beach ($803,600) and Whangamata ($773,850).
CoreLogic E-Valuer valuation reports are available from QV.co.nz.
The E-valuer reports are tested each week against property sales from the last six months.
The QV website says test results show that the E-valuer values properties within 10 per cent of the actual selling price over 69 per cent of the time, and within 20 per cent of the selling price for over 93 per cent of properties.

Median house valuations on April 30, by suburb, according to CoreLogic’s E-Value Estimate:

Hilltop: $533,500, a 2.6% increase in the Jan ro April 31 quarter. The median on March 31 ($534,100) was an increase of $24,000 (4.7%) on March 2017’s median of $534,100.
Kinloch: $662,700, a 0.6% increase in the Jan-April quarter. The median on March 31 ($660,800) was an increase of $38,450 (6.2%) on March 2017’s median of $622,350.
Kuratau: $450,550, a 2.2% increase in the Jan-April quarter. The median on March 31 ($445,400) was an increase of $30,950 (7.5%) on March 2017’s median of $414,450.
Nukuhau: $501,150, a 0.7% increase in the Jan-April quarter. The median on March 31 ($500,250) was an increase of $23,550 (4.9 %) on March 2017’s median of $476,700.
Omori: $406,800, a 2.7% increase in the Jan-April quarter. The median on March 31 ($407,200) was an increase of $34,000 (9.1%) on March 2017’s median of $373,200.
Richmond Heights: $451,200, a 2.3% increase in the Jan-April quarter. The median on March 31 ($454,900) was an increase of $35,550 (8.5%) on March 2017’s median of $419,350.
Tauhara: $314,250, a 1.8% increase in the Jan-April quarter. The median on March 31 ($314,100) was an increase of $20,500 (7%) on March 2017’s median of $293,600.
Taupō centre: $427,000, a 2% increase in the Jan-April quarter. The median on March 31 ($428,550) was an increase of $25,600 (6.4%) on March 2017’s median of $402,950.
Turangi: $226,050, a 3.9% increase in the Jan-April quarter. The median on March 31 ($223,100) was an increase of $28,600 (14.6%) on March 2017’s median of $194,600.
Waipahihi: $639,250, a 0.9% increase in the Jan-April quarter. The median on March 31 ($640,550) was an increase of $39,500 (6.5%) on March 2017’s median of $601,500.

Nearby towns:
Taumaranui: $146,800, a 3.6% increase in the Jan-April quarter. The median on March 31 ($145,100) was an increase of $16,700 (3.6%) on March 2017’s median of $128,400.
Tokoroa: $189,900, a 2.3% increase in the Jan-April quarter. The median on March 31 ($189,800) was an increase of $25,000 (15.2%) on March 2017’s median of $164,800.
Putaruru: $299,700, a 1.4% increase in the Jan-April quarter. The median on March 31 ($298,150) was an increase of $59,250 (24.8%) on March 2017’s median of $238,900.[CUT FOR SPACE]
Cambridge: $674,550, a 0.9% increase in the Jan-April quarter. The median on March 31 ($674,550) was an increase of $46,050 (7.3%) on March 2017’s median of $628,500.
Huntly: $351,600, a 2.1% increase in the Jan-April quarter. The median on March 31($347,700) was an increase of $27,450 (8.6%) on March 2017’s median of $320,250.