Following the Tongariro river updated post, TRM inmates have requested more info on tracking the Tongariro spawning runs.
DOC’s Waipa trap results have been difficult to compare year by year or month by month due to flood conditions forcing the trap to close just when anglers wanted to compare and analyse the conditions.
TRM posted a previous report on this in March 2019 as follows:
Tracking Tongariro spawning runs?
Following informative article copied from Page 12 of Fishing & Outdoors Newspaper:
Tracking spawning runs on the Tongariro River…
Due to previous report stuff on the nature of Tongariro River spawning runs, TRM have been reminded of the previous experiments using radio tracking by DOC (Department of Conservation are the fishery managers in the Taupo region) that will be of interest to Tongariro trout fishing junkies.
The eventual results may have taken a few years but shattered many preconceptions that anglers previously had about trout spawning runs.
On right are the old Target Taupo magazines from 1995 (issue 19), July 2002 (issue 40), July 2003 (issue 43), November 2003 (44), & March 2004 (45). These still provide great reading. Anglers wish they were still being produced, instead of this computer generated nonsense…
Thank you to DOC contributors over that time – Glenn Maclean, Michel Dedual, Rob Hood, & Mark Venman.
We tried to copy & paste the articles but their layout and wording suffered in the process so TRM had to summarise. The last article alone was over ten pages so needed reducing to fit modern anglers’ concentration span.
We trust the TRM summarised version follows the original experiment and results. As the experiments were spread over 10 years and four issues of TT magazines a lot of info has been necessarily deleted. Some of the charts have not been suitable to copy as well.
Nevertheless, it is still interesting to Tongariro fishos as the trout have not read it and still follow much the same spawning habits.
July 1995
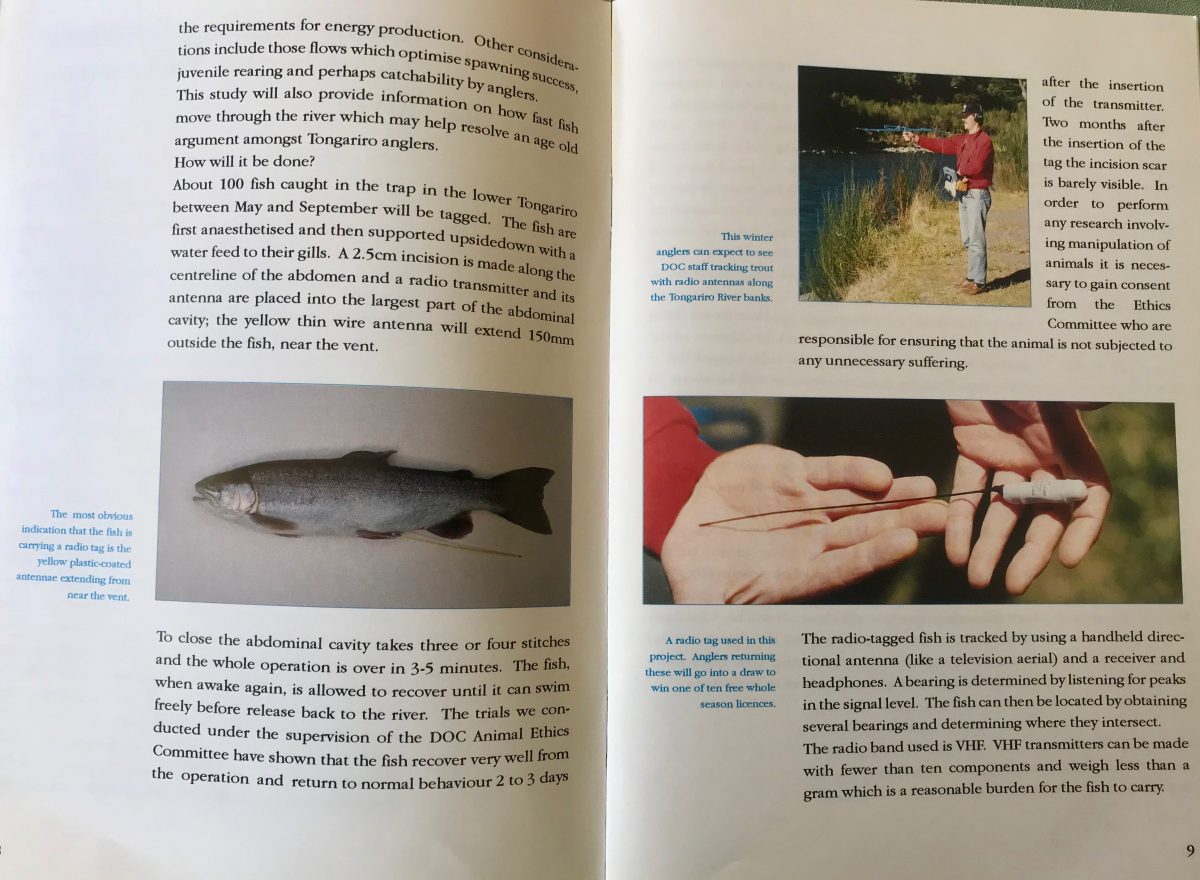
The stated aim was to analyse how fast the trout move up(and on some occasions down), where they rest in the river, favourite holding pools, runs or riffles, and areas to be avoided, to compare favoured trout holding pools with those favoured by anglers, to understand what makes these areas more desirable, to measure features like water velocity, bed material, depth, presence of cover, etc. Most of these parameters controlled by the flow.
By tracking tagged trout and noting habitat characteristics at different flow conditions DOC could assess what flow would maximise the preferred habitat for migrating trout.
How was it done? About 100 trout were to be caught in a trap in the lower Tongariro between May and September and tagged.
July 2002
By Michel Dedual
DOC provided reasons for delays and how they were going to do it. They explained the experiment was similar to the 1995 & 1996 project when they attempted to index the Tongariro River run to the run in the Whitikau Stream. (?)
They mentioned the Tongariro runs numbered 60,000 in 1995 with approximately 5000 trout passing through the Waipa trap.
As part of the radio tracking they noticed not all fish tagged and released in the lower river moved further upstream. Two died and some others returned to Lake Taupo. Overall 80% of the fish tagged were tracked.
Of 100 tagged in the lower river 10 were recaptured in the Waipa trap. From this they deduced a total run of 40,000 or 20% smaller in 2002.
The article was followed by a “STOP PRESS” that read the project was delayed due to weather issues and risks of losing tags which cost $300 per tag.
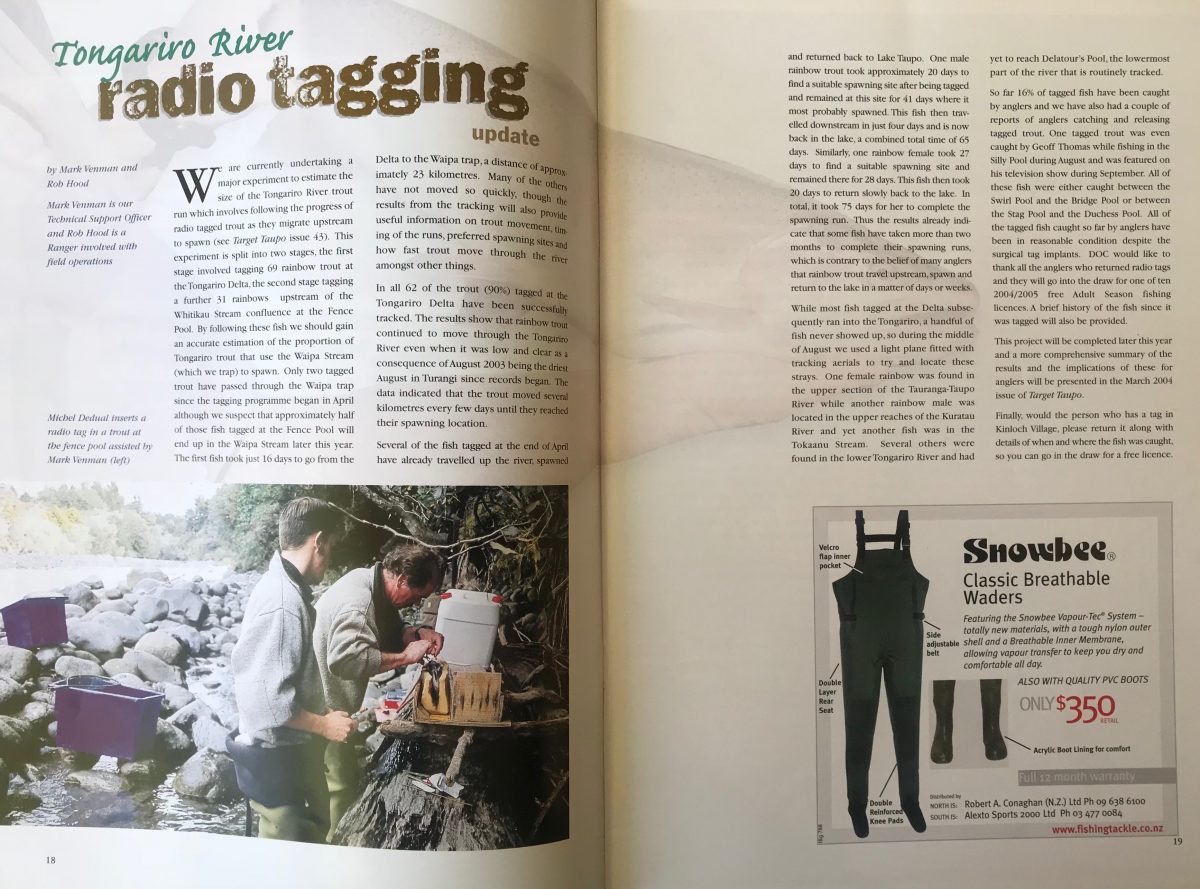
July 2003
By Rob Hood
The 2003 article mentioned the research programme finally started in 2002?
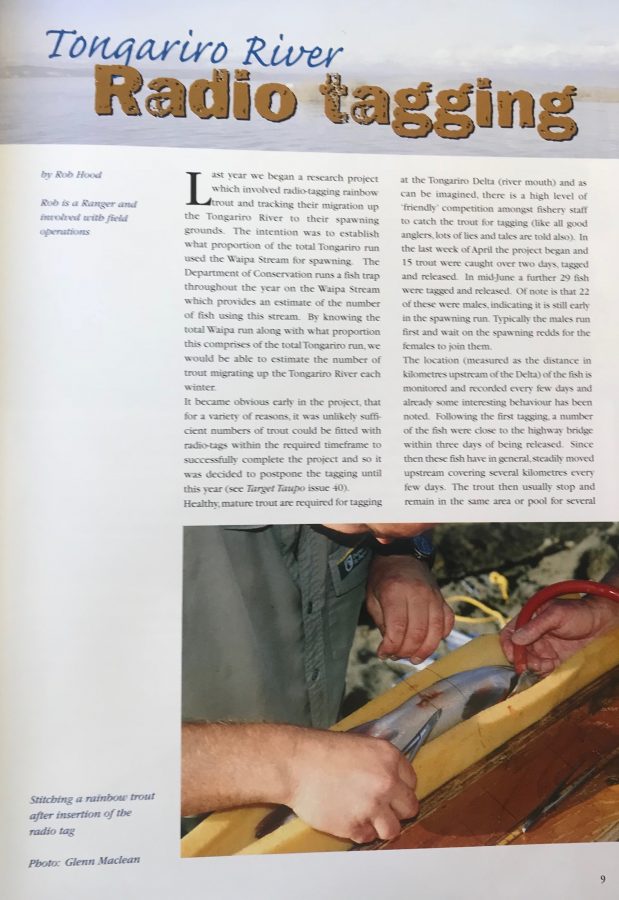
The aim or intentions were revised and limited to establish what proportion of the Tongariro run used the Waipa Stream for spawning.
The project began in late April when 15 trout were tagged and released. In mid-June a further 29 were tagged and released. Of note, 22 were male, indicating it was still early in the spawning run.
Following the first tagging a number were close to the SH1 bridge within 3 days of being released.
Since then they moved steadily upstream covering several km every few days.
The trout then stop and remain in the same area or pool for several weeks. They could have been either spawning or resting.
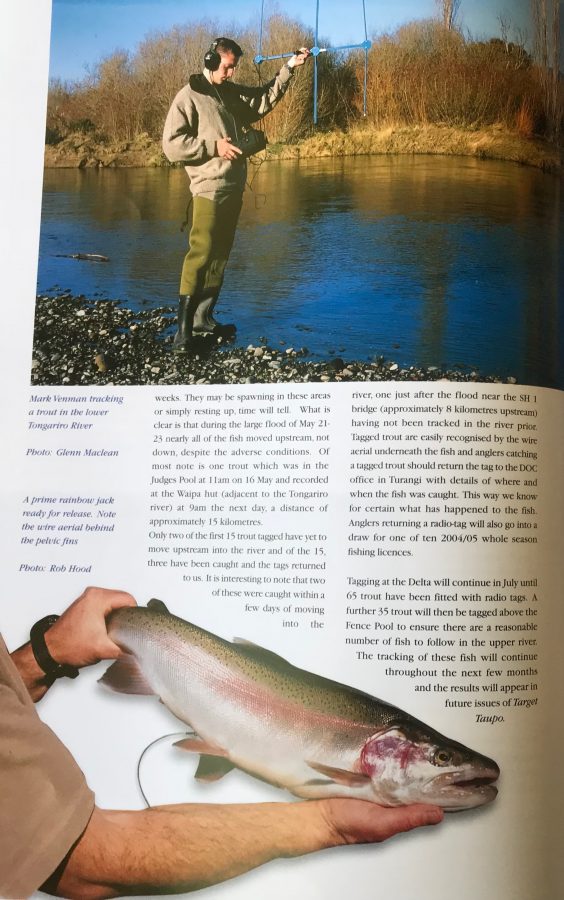
During a large flood of May 21-23 nearly all fish moved upriver, not down, despite the adverse conditions.
Of particular note was one trout recorded in Judges Pool at 11am on 16 May and recorded at the Waipa trap at 9 am the next day, a distance of approximately 15 km.
Tagging at the Delta was to continue until July until 65 trout were fitted with radio tags.
Also a further 35 trout were to be tagged above the Fence Pool to ensure there were reasonable number of trout to follow in the upper river.
Continuing on from the DOC trout radio tracking project which started in 1995 and ended in 2004…
Even to briefly summarise the main findings has been a big project for TRM’s extensive research team, but the huge effort that went into it by DOC over all that time is a credit to the dedication of the fishery management team back then.
So in their March 2004 issue 45, Target Taupo reported a total of 108 Rainbow trout were captured (without harming them!)and surgically implanted with radio transmitters before being released to continue their monitored spawning runs up the Tongariro River.
This followed a similar experiment in 1995.
In the seven years between the studies the Tongariro River changed significantly as a consequence of the 1995 & 1996 eruptions on Mt. Ruapehu and the July 1998 floods.
DOC followed 92 of the released trout until November.
Another ten trout were found elsewhere and six went missing completely.
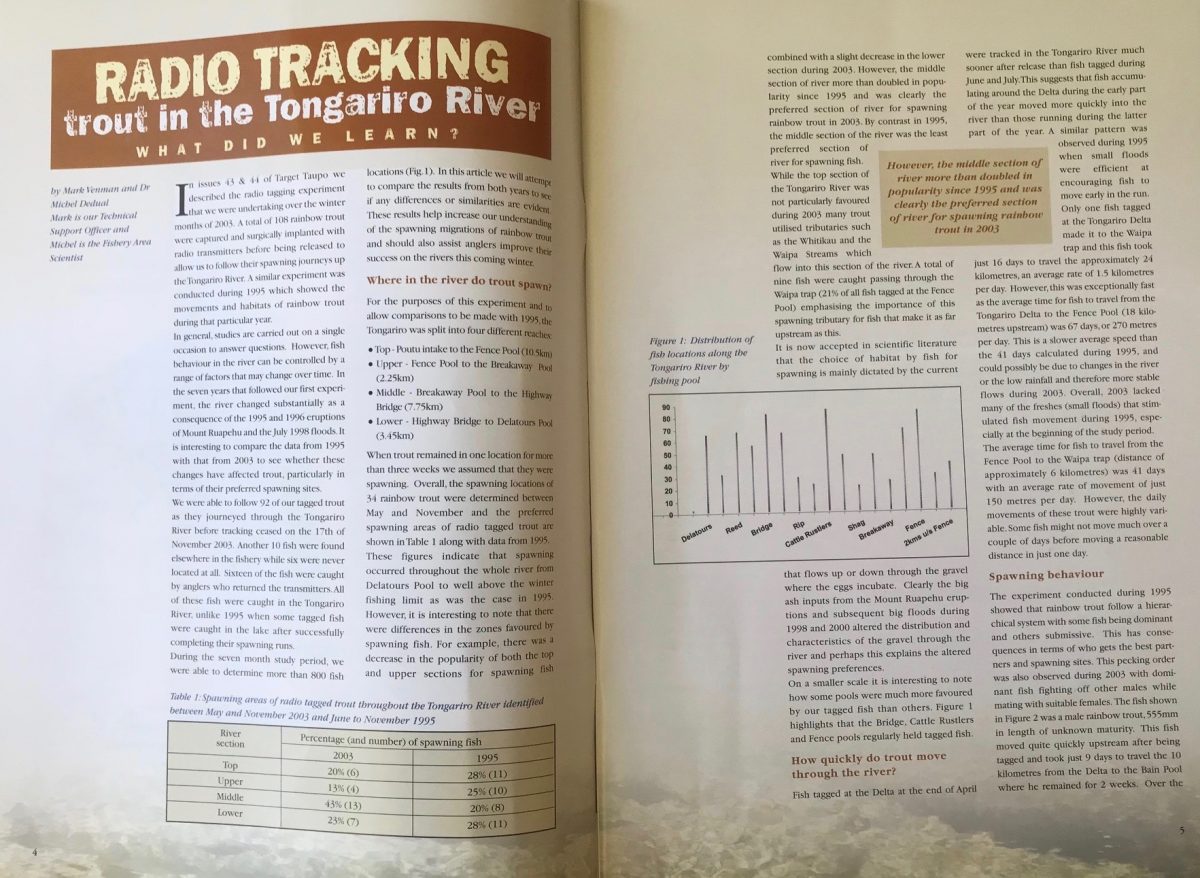
During the 8 month study DOC determined more than 800 fish locations with a spread as follows:
A comparison of the spread pattern between 2003 & 1995 follows:
LOCATION 2003 1995
Top river 20% (6) 28% (11)
Upper river 13% (4) 25% (10)
Middle river 43% (13) 20% (8)
Lower river 23% (7) 28% (11)
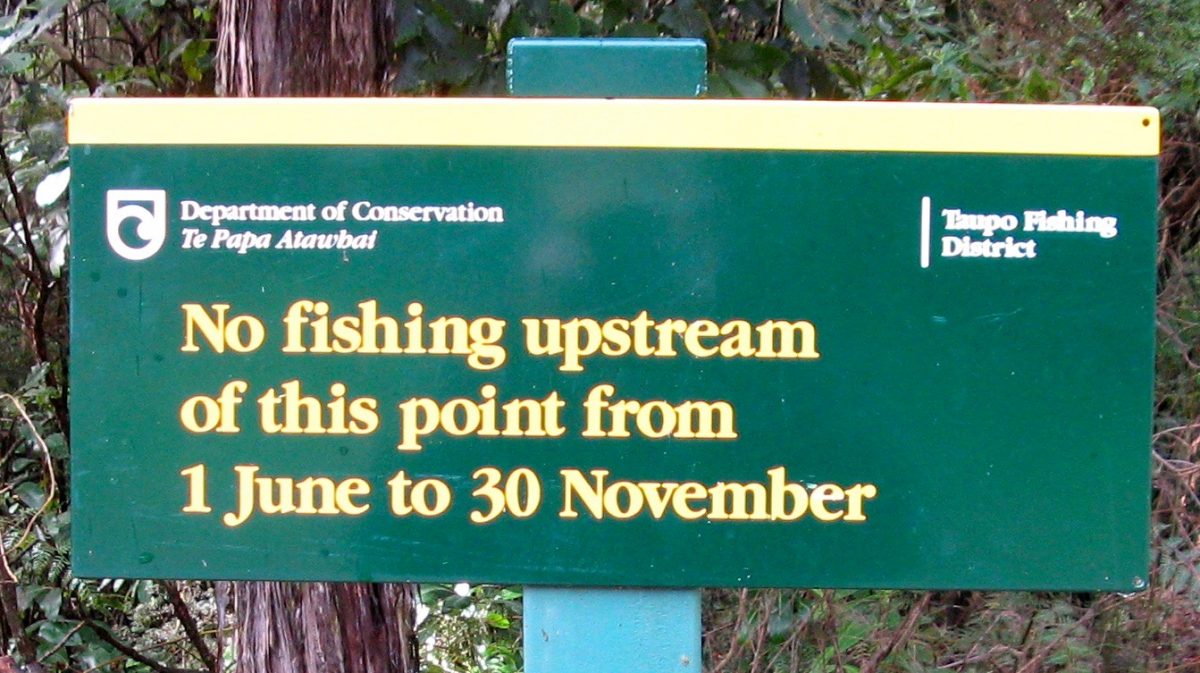
Top river was above Fence Pool to Poutu Intake (10.5km)
Upper river was Fence Pool to Breakaway Pool (2.25km)
Middle river was Breakaway to SH 1 traffic bridge (7.75km)
Lower river was SH1 bridge to De Latours Pool (3.45km).
(The Breakaway Pool used to be above the Cliff Pool & below Big Bend. Nature decided to bypass it.)
(Sadly, De Latours Pool has also gone, now bypassed and destroyed by “flood protection” (?) works. No thanks to WRC (Waikato Regional Council) who excavated a new canal down to Reed Pool. The lower river is still a recovering mess and still changing every season. Delatours was an important brown trout nursery in the big loop at the end of Grace Road below the Bends Pool. See map below.)
The differences in preferred spawning locations, between 1995 and 2003 were due to big ash deposits from Mt Ruapehu eruptions and subsequent big floods in 1998 and 2000. On a smaller scale it was interesting to see that the three most favoured pools back then were Bridge Pool, Cattle Rustlers and Fence Pool.
(Would you have chosen the latter two?)
How quickly did trout move through the river?
Trout tagged at the Delta at the end of April were tracked in the river much sooner after release than fish tagged during June & July. This suggested that fish from the Delta move much quicker in the early part of the season than those running during the latter part of the season.
Only one trout tagged at the Delta made it to the Waipa trap taking 16 days for 24km (av. 1.5 km per day) but this was exceptionally fast.
The average time for a trout to travel from the Delta to the Fence Pool – 18 km upriver – was 67 days = 270 metres per day. This was a slower average speed than the 41 days calculated in 1995.
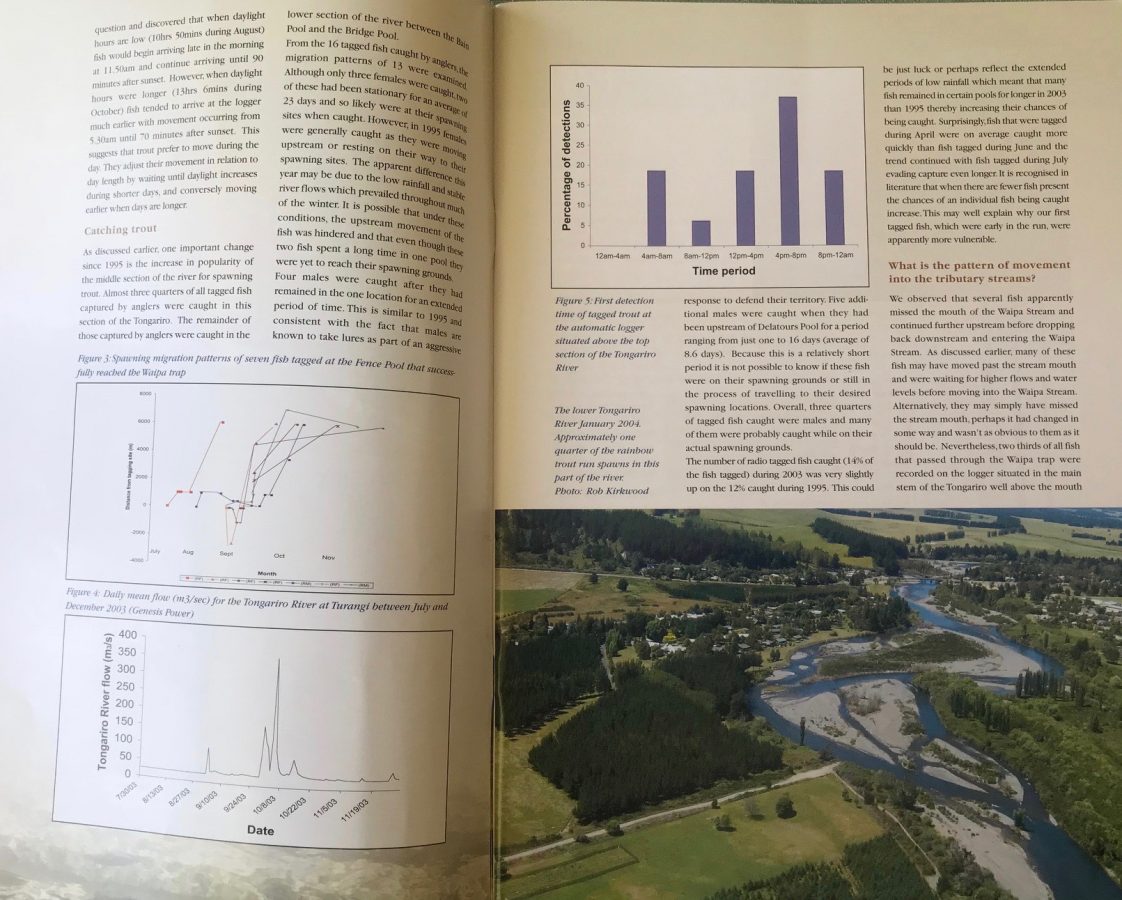
The average time for trout to travel approximately 6 km. from the winter limit Fence Pool to the Waipa trap was 41 days = 150 metres per day. However the daily movements were highly variable. Some fish might not move over a couple of days before moving a considerable distance in just one day.
(This is why TRM continually have to remind fishos that when DOC report of x fish passing through the Waipa trap, – as they did on 17 October when 45 went through overnight – those trout were most likely passing through Turangi pools up to 2 months before…)
Spawning behaviour
The 1995 experiment confirmed that rainbow trout follow a hierarchical system. This pecking order was also observed in 2003 with dominant fish fighting off other males while mating.
The weather – i.e. rain fall producing variable flows – was the key criteria to stimulate movement. During 1995 it was found that every fresh induced an increase in daily movement rates and that tended to occur both as the river was rising and receding. This pattern was followed in 2003.
i.e. The behaviour of one jack was reported as an example. After being tagged it took 9 days to travel 10 km to the Braids where he remained for 2 weeks. Over the next 7 days he moved to the Breakaway Pool 9 km upriver where he remained for 42 days while he spawned. Then he rapidly headed down river to Reed Pool for another 47 days where he probably spawned again?. Then he headed back to the lake.
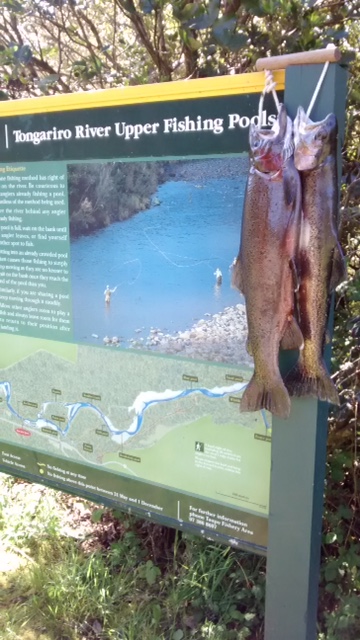
This type of behaviour was consistent with a dominant male as he was big enough – measured at 555 mm – to be capable of fighting off other males at two separate locations for a period of more than one month while mating.
When do fish move?
(This is particularly for those TRM inmates who have to be first into a pool at daybreak as they are convinced the trout only move in at night?)
From data using a logger at the Waipa Steam to record the arrival times for 16 fish over 3 months, they reported no fish arrived between midnight and 4am with most of the morning movement between 4am and 8am. Overall 25% of trout arrived between midnight and midday. The remaining 75% arrived between midday and midnight with the majority (37.5%) arriving between 4pm and 8pm. So it appeared from their study that more move between midday and midnight with the majority between 4 pm and 8pm. (That may also explain why many TRM inmates realise they do not have to be the early bird – they wait until after the first ‘shift’ of anglers return to then catch the worm?)
Another pattern observed was for trout to pass a spawning stream and rest just upstream before dropping back to enter the stream after a few weeks. (i.e. Hydro Pool’s Mangamawhitiwhiti Stream or Poutu Pool or Whitikau Stream)
Catching trout
Almost three quarters of all tagged fish were caught in the middle pools. The remainder were caught in the lower section between Bain Pool and the Bridge Pool – aka Braids.
Estimating the Tongariro River spawning runs
One of the main objectives of the study was to estimate the size of the run. They estimated that between April and November 2003 the total was 80,000 fish. This was higher than 1995 figure of 60,000.
Conclusions
From comparison of the 1995 and 2003 surveys of the most popular pools, possibly due to flooding the favoured pools changed considerably. In 1995 they identified Reed, Swirl, Hydro, Red Hut and Blue Pools. Compare 2003 when they chose Delatours, Bridge, Cattle Rustlers, Poutu and Fence Pools, but flooding (and Waikato Regional Council “flood protection” (?) works using diggers and bulldozers) has since changed these pools. They commented on the need for anglers to keep an open mind and move around more if your favourite pool stops producing.
(Tongariro River as it was in 2003, showing the pools referred to in the article – P 12, Target Taupo March 2004 Issue 45)

Previous StoryTracking spawning runs on the Tongariro River…Next